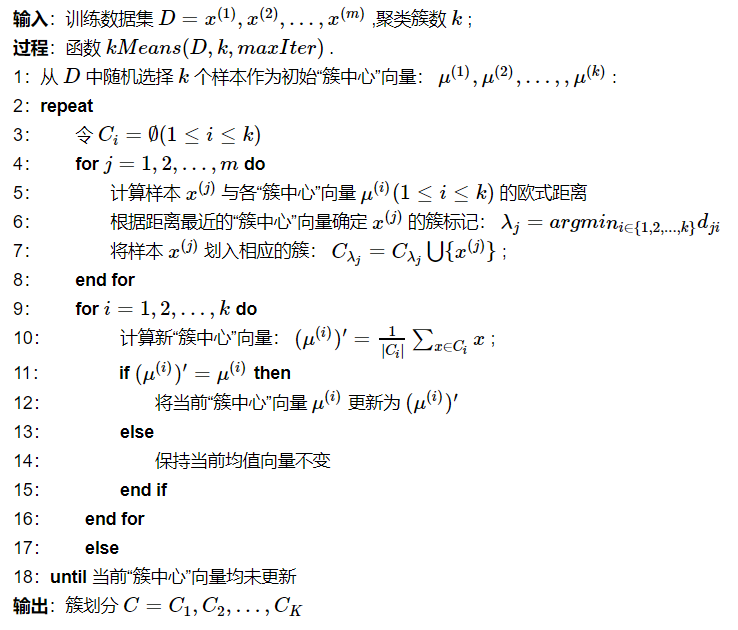
1
2
3
4
5
6
7
8
9
10
11
12
13
14
15
16
17
18
19
20
21
22
23
24
25
26
27
28
29
30
31
32
33
34
35
36
37
38
39
40
41
42
43
44
45
46
47
48
49
50
51
52
53
54
55
56
57
58
59
60
61
62
63
64
65
66
67
68
69
70
71
72
73
74
| import numpy as np
from matplotlib import pyplot as plt
def dis(a, b):
return np.sqrt(np.sum((a - b) ** 2))
def func(points, k=5, disthre=1e-5):
n_points = len(points)
centroid_indexs = np.random.choice(range(n_points), k)
centroid_coords = points[centroid_indexs]
labels = [-1 for i in range(n_points)]
max_proc_cnt = 1000
proc_cnt = 0
while True and (proc_cnt < max_proc_cnt):
for i in range(n_points):
point_rep = np.repeat(np.expand_dims(points[i], 0), repeats=k, axis=0)
point_rep = np.sqrt(np.sum((point_rep - centroid_coords) ** 2, axis=1, keepdims=True))
centroid_min_oriIndex = np.argmin(point_rep, axis=0)[0]
labels[i] = centroid_min_oriIndex
centroid_updated = False
for i, centroid_coord in enumerate(centroid_coords):
cluster_points = []
for j in range(n_points):
if labels[j] == i:
cluster_points.append(points[j])
cluster_points = np.concatenate([cluster_points], axis=1)
new_centroid_coord = np.sum(cluster_points, axis=0, keepdims=True) / len(cluster_points)
if dis(centroid_coord, new_centroid_coord) > disthre:
centroid_coords[i] = new_centroid_coord
centroid_updated = True
if not centroid_updated:
break
proc_cnt += 1
print('fnished with {0}(s) loop'.format(proc_cnt))
return labels
def kmeans_demo():
n_points = 100
n_clusters = 5
X = np.random.rand(n_points, 2) * n_points
colors = ['pink', 'red', 'blue', 'green', 'cyan']
plt.figure()
ax1 = plt.subplot(1, 2, 1)
ax2 = plt.subplot(1, 2, 2)
plt.title('K-means demo(k={0})'.format(n_clusters), fontsize='large', fontweight='bold')
plt.sca(ax1)
plt.scatter(X[:, 0], X[:, 1], marker='.', color='red', s=20, label='First')
labels = func(points=X, k=n_clusters, disthre=1e-7)
plt.sca(ax2)
for i in range(n_points):
plt.scatter(X[i, 0], X[i, 1], marker='.', color=colors[labels[i]], s=20, label='Second')
print(labels)
for cid in range(n_clusters):
print('{0} cluster(colored {1}) has {2} points'.format(cid, colors[cid], labels.count(cid)))
plt.show()
if __name__ == '__main__':
kmeans_demo()
|


